Greener —
Demand and carbon emissions are way down, renewables far more common than expected.
John Timmer
–

On Monday, the Department of Energy’s Lawrence Berkeley National Laboratory released a report entitled “Halfway to Zero,” referring to a goal of a zero-emission US electric grid. The report’s headline claim is a bit bogus, in that we’ve not cut our emissions in half relative to any point in history. Instead, they’re down to half of where they were projected to be in a report issued back in 2005.
Still, despite this sleight of hand, the report makes for interesting reading in that it shows how rapidly the energy market has changed and where the trends that are driving those changes might lead us in another 15 years. So while we’re not really in a place to be patting ourselves on the back for everything we’ve accomplished, the report does provide reasons for optimism.
Persistently wrong projections
The foundation for the new work is one of the many editions of the Energy Information Agency’s (EIA) Annual Energy Outlook, specifically the one from 2005. These publications take a look at the state of the US energy markets in the most recent year for which there is data and tries to project how those markets will evolve over the coming years. In 2005, that meant that projections went as far as 2025.
You can get a sense of where things were expected to go simply by looking at the cover of the report, which is graced by a picture of an oil well. To an extent, conservative projections are baked into the structure of the report; it assumes that the only policies that influence energy markets are the ones currently on the books. So even though Congress has extended the expiration date on tax credits for renewable power multiple times, the EIA always makes projections that have them expiring as scheduled at the time.
The EIA also tends to assume slow and steady technological progress rather than the sorts of changes that have led solar prices to drop by a factor of five in less than a decade.
So the EIA projections will be wrong, and everyone knows they’ll be wrong and has a good sense of why. The new report acknowledges that situation very early on and just moves on to the comparisons. And the comparisons it makes are informative in that they show what factors are the leading causes of the mismatch between the projections and the reality that has since taken place.
In this case, however, there’s an added wrinkle: the COVID-19 pandemic, which has lowered energy use in the US considerably. It’s likely that at least some of the factors that drove the changes in energy use, like increased work from home, will outlast the pandemic, but it’s difficult to know how different things will be. While the report also performs an analysis using 2019 data to avoid this complication, we’ll largely focus on the 2020 results.
Demand is less demanding
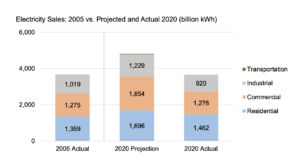
One of the biggest factors that has changed what’s happened on the grid is a drop in demand compared to expectations. In its 2005 projections, the EIA had expected total demand for electricity to rise by roughly 25 percent. Instead, it stayed essentially flat. None of the main sectors—residential, commercial, or industrial—rose significantly, due to factors like increased efficiency and a shift away from heavy industry. (Remember, products like LED bulbs were expensive rarities 15 years ago.)
This had some significant effects. For example, the EIA projected a large increase in natural gas use by 2020 and got the magnitude nearly right. But in its projections, this expanded generation was expected to feed the rising demand; since that never materialized, gas displaced coal instead.

Enlarge / Rather than rising as projected, demand has largely remained flat.
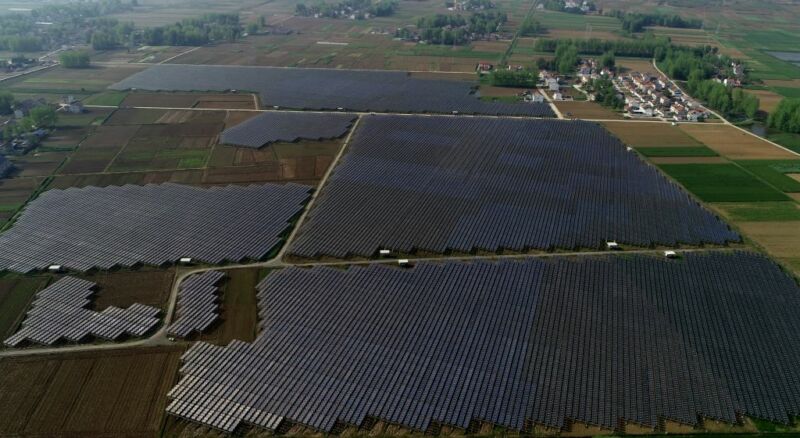
Coal also took a big hit from the rise in renewables, with wind and solar producing 13 times more than they were expected to back in 2005. Combined with hydropower and other renewable sources, that has boosted the total share of renewable generation to 79 percent higher than the EIA had projected. There are plenty of reasons for this, including the fact that tax breaks for renewables were extended several times. In the absence of a coordinated federal response to climate change, many states have crafted renewable power mandates. Finally, there’s that tremendous drop in price noted above, which has made solar and wind the cheapest sources of power in many areas of the country.
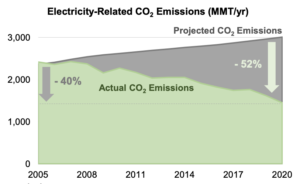
Combined, those factors have produced a serious drop in carbon emissions: 40 percent since 2005, or about a third of the way toward a zero-emissions grid. Compared to the 2005 projections for this year, which had pencilled in continued heavy use of coal and rising demand, emissions are down by 52 percent—the “halfway to zero” of the report’s title.
Counting costs
In 2005 (and for a number of years afterward), people frequently announced that reducing the carbon emissions of the grid would come at a catastrophic cost. That has turned out to be very wrong. Retail electricity prices (in 2005 constant dollars) went from 10.6 cents/kiloWatt-hour all the way up to… 10.7 cents/kW-hr. The projections had them falling slightly, so we’re in worse shape than expected in this sense, but it’s anything but a crippling rise in price.
In fact, because there are more customers for a similar amount of power, use per customer has gone down in the last 15 years. That means that, individually, customers’ bills are a bit smaller, even if they’re paying more.
And that movement has been accompanied by a huge drop in associated costs. Climate damages, estimated using the social cost of carbon, were cut by more than half, from a projected $229 billion down to only $110 billion. But the huge plunge in the use of coal, along with added pollution controls, cut down on numerous additional costs. Health costs from the pollution, expected to total over a half-trillion dollars, instead came in at $34 billion—an astonishing drop. The projected 38,000 annual premature deaths from pollution instead came in at 3,100.

Enlarge / Any way you look at it, carbon emissions are down.
If these costs are counted along with the electrical bills, the total costs of generating power were actually down by 44 percent from 2005 and less than half of what was projected for 2020.
Despite the fact that the cost of the energy is largely the same in constant dollars, the energy industry is employing a lot more people. Despite the boost in production, the number of jobs in natural gas production has stayed largely the same, while those employed producing coal has dropped considerably. But renewable energy production is labor-intensive, which has led to a dramatic jump in jobs and brought the total number of people employed in producing electricity up 29 percent compared to projections.
Where to from here?
While we may not be halfway to a net-zero emissions grid, we’re a lot closer than might be expected. Are we on a trajectory that makes zero emissions possible within the sorts of time frames we’d need in order to hit climate goals? The report acknowledges that decarbonizing the last 10 percent of the grid using intermittent power sources is going to be an extremely complex challenge, and it will likely involve some combination of greater grid integration, demand management, storage, and carbon capture. But we have a lot of decarbonization to do before we even get to the 10 percent mark, and it’s here that we can largely focus on trends in existing technology.
The report notes that wind, solar, and batteries have all gotten cheaper much faster than anyone expected, making deep decarbonization an economic possibility. But there’s still the challenge of scaling production and installation of renewables and storage fast enough.
To get to a situation where 90 percent of the electricity generated in the US is free of carbon emissions, it’s estimated we’ll need to install about 1.1 terawatts of wind and solar capacity by 2035. Right now, there have been applications to connect roughly half that amount by the end of 2025, a pace of over 100 GW/year, well above what’s needed. But historically, many of these projects aren’t built; as a contrast, only 34 GW was installed in 2020, which is only a third of the expected pace.
We’d need to double last year’s total starting this year and maintain that pace for a decade to hit the 90 percent emissions-free goal. Plus we have to build enough grid infrastructure to connect it all. That’s not going to be easy. For a sense of how difficult it will be, compare the 70 GW/year figure to the big plan to expand offshore wind production in the US, which is only targeting three GW/year for the rest of this decade.
Achieving the sort of scale we need is going to be the real challenge if we want to hit our climate goals. And so far, even with a renewable-friendly administration in the White House, there’s been no indication of how we might do it.

