Wind Power —
The 2019 numbers show projects are up, costs are down.
Scott K. Johnson
–

Earlier this year in the US, energy generation from wind, solar, and hydroelectric dams combined to top coal generation for over two months straight. This was the product of spring peaks in renewable generation and reduced electrical demand during lockdowns, but those events were layered on top of coal’s continuing decline and the long-term growth of renewables. A new report from the Lawrence Berkeley National Laboratory looks back at 2019—what is now known as the Before Times—to tally up year-end totals for the wind industry.
The topline number is that a little over nine gigawatts of wind capacity was added last year—slightly more than in each of the four previous years. Wind accounts for about one-third of all new generation added in 2019, and it ticked up to seven percent of all electricity generated in the US.
But as for the grid carrying that electricity, a little under 1,000 miles of transmission lines were built last year—the second lowest amount in the last 10 years.
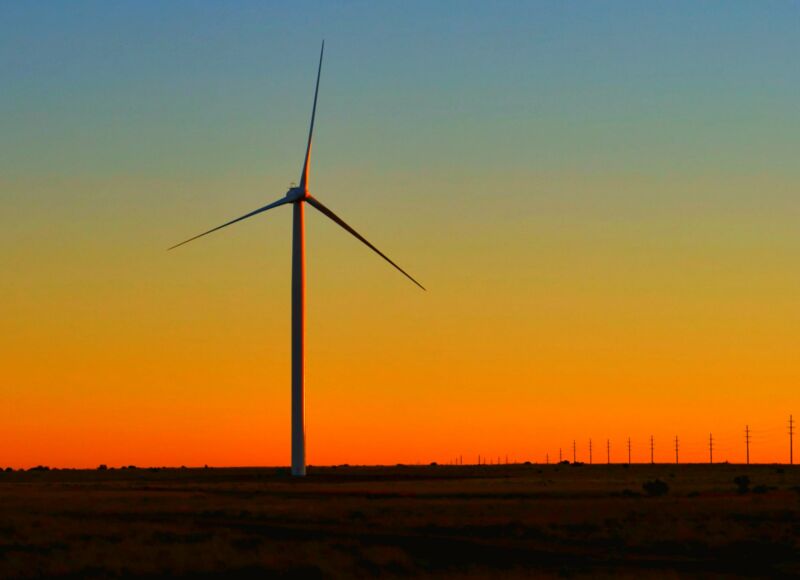
The trend toward bigger wind turbines continued, with the average capacity of a turbine built last year reaching 2.55 megawatts. The height of the tower on which the turbine sits has risen over time—now averaging 90 meters—but the bigger factor is longer blades. Average rotor diameter was 120 meters, up from closer to 80 meters a decade ago.
For grid region abbreviations, see the map here.
New projects in 2019 (yellow dots) and total installed wind capacity by state.
Transmission infrastructure has gotten less attention.
Turbines are getting larger over time, with a higher average capacity.
Over 1,800 older turbines were retrofitted last year, mostly with longer blades. That slightly increases their maximum capacity, but more importantly it leads to more consistent generation. These changes have boosted “capacity factors”—the average fraction of a turbine’s maximum capacity that it is generating as the winds vary over the days and seasons. The report notes that the average capacity factor of turbines built 2014-2018 was 41 percent, beating out turbines built 2004-2012 that come in at 31 percent. Newer turbines are also aging more gracefully, maintaining their output better than wind farms built before 2008.
Costs, meanwhile, continue to tick down from a 2010 peak, reaching about $850 per kilowatt for turbines and $1,400 per kilowatt on the project scale. That brings the average cost of electricity produced from wind to $36 per megawatt-hour. Wind has maintained its cost lead over natural gas electricity, although solar electricity has caught up in the last few years.
Capacity factor has ticked up over time.
Newer turbines aren’t seeing the capacity factor decline after 10 years that earlier turbines were.
Per-kilowatt-hour costs of new projects have declined over the last decade.
This cost of electricity calculation accounts for construction and ongoing costs, averaged over the lifetime of the project.
Wind electricity (blue), solar (yellow), and natural gas (black) have converged over time.
Here’s the report’s outlook for wind installations in the next few years.
While the report projects wind to gradually get cheaper in the future, it also notes that wind is losing a bit of its edge as its slice of the generation pie increases. With transmission capacity still limited, electricity from wind-rich areas in the middle of the country can’t easily be sent to meet demand elsewhere. Without storage, the variability of the wind energy becomes more important as it becomes a bigger player on the grid.
The report still projects a significant increase in wind projects through 2020 (caveat: COVID-19) and 2021. But between the factors mentioned above and (more importantly) the planned phase-out of federal tax incentives for renewable energy, the outlook sees a sharp drop after 2021. Annual wind project activity is pretty sensitive to policy—just look at the swing between 2012 and 2013, when projects were rushed in ahead of the deadline the last time tax credits expired—so actions on the state and national level could yet shift that outlook.

